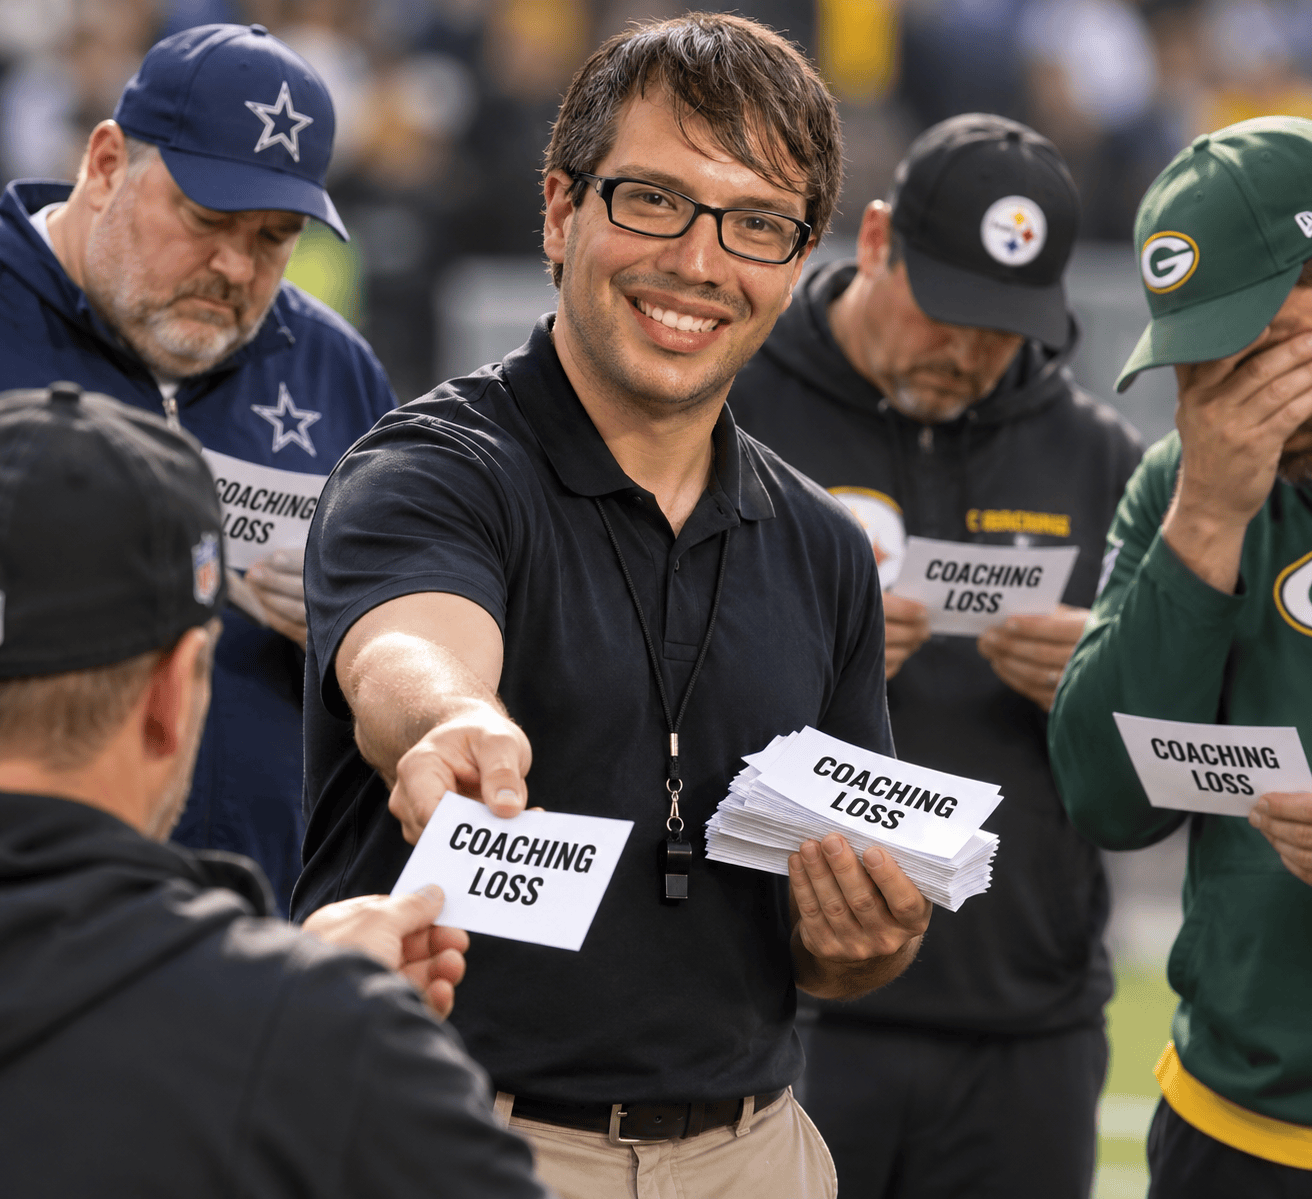
Welcome back to the latest chart of regret!
Weeks 4 & 5 saw some shakeups in the rankings, with Jon sliding down the list with a coaching loss, while Trigger and Kaiser both climbed up a few spots. Let’s take a look…
| # | Pre | Coach | Loss | 50-99 | 100-199 | 200-299 | 300+ | Total | Pts. |
| 1 | 1 | Ryan | 0 | 5 | 1 | 0 | 0 | 6 | 7 |
| 2 | 5 | Trig | 0 | 3 | 3 | 0 | 0 | 6 | 9 |
| 3 | 6 | Kaiser | 0 | 1 | 3 | 1 | 0 | 5 | 11 |
| 4 | 3 | Jim | 0 | 3 | 3 | 1 | 0 | 7 | 13 |
| 4 | 6 | Dave | 0 | 1 | 4 | 1 | 0 | 6 | 13 |
| 6 | 8 | Kron | 0 | 3 | 6 | 0 | 0 | 9 | 15 |
| 7 | 4 | Shaun | 0 | 5 | 4 | 1 | 0 | 10 | 17 |
| 7 | 9 | Kyle | 1 | 2 | 1 | 0 | 0 | 3 | 17 |
| 7 | 9 | Matt | 1 | 4 | 0 | 0 | 0 | 4 | 17 |
| 10 | 2 | Jones | 1 | 4 | 1 | 0 | 0 | 5 | 19 |
| 11 | 11 | Josh | 1 | 1 | 7 | 0 | 0 | 8 | 28 |
| 12 | 12 | Chris | 2 | 2 | 5 | 1 | 0 | 8 | 42 |
Things are pretty tight across most of the board, with Dave and Jim sharing that 4-spot, and the 7 slot currently has three men inside of it.
Here’s the raw per week numbers to this point…
| BK | KS | MS | JK | JT | RK | JJ | CT | DA | SK | MK | MA | total | |
| W1 | 3 | 0 | 2 | 2 | 1 | 1 | 1 | 2 | 2 | 0 | 1 | 0 | 15 |
| W2 | 1 | 0 | 1 | 0 | 0 | 1 | 1 | 1 | 0 | 2 | 1 | 2 | 10 |
| W3 | 1 | 0 | 1 | 0 | 2 | 0 | 1 | 1 | 2 | 1 | 2 | 0 | 11 |
| W4 | 2 | 1 | 1 | 2 | 2 | 2 | 0 | 0 | 2 | 4 | 1 | 2 | 19 |
| W5 | 2 | 1 | 1 | 1 | 2 | 2 | 0 | 1 | 0 | 3 | 0 | 0 | 13 |
| W6 | 0 | 0 | 0 | 0 | 0 | 0 | 0 | 0 | 0 | 0 | 0 | 0 | 0 |
| W7 | 0 | 0 | 0 | 0 | 0 | 0 | 0 | 0 | 0 | 0 | 0 | 0 | 0 |
| W8 | 0 | 0 | 0 | 0 | 0 | 0 | 0 | 0 | 0 | 0 | 0 | 0 | 0 |
| W9 | 0 | 0 | 0 | 0 | 0 | 0 | 0 | 0 | 0 | 0 | 0 | 0 | 0 |
| W10 | 0 | 0 | 0 | 0 | 0 | 0 | 0 | 0 | 0 | 0 | 0 | 0 | 0 |
| W11 | 0 | 0 | 0 | 0 | 0 | 0 | 0 | 0 | 0 | 0 | 0 | 0 | 0 |
| W12 | 0 | 0 | 0 | 0 | 0 | 0 | 0 | 0 | 0 | 0 | 0 | 0 | 0 |
| W13 | 0 | 0 | 0 | 0 | 0 | 0 | 0 | 0 | 0 | 0 | 0 | 0 | 0 |
| W14 | 0 | 0 | 0 | 0 | 0 | 0 | 0 | 0 | 0 | 0 | 0 | 0 | 0 |
| Total | 9 | 2 | 6 | 5 | 7 | 6 | 3 | 5 | 6 | 10 | 5 | 4 | 68 |
| Avg | 1.8 | 0.4 | 1.2 | 1.0 | 1.4 | 1.2 | 0.6 | 1.0 | 1.2 | 2.0 | 1.0 | 0.8 | 13.6 |
As for Coaching Losses, let’s see where we stack up against years passed…
| League Coaching Losses | |||
| Year | Losses | Weeks | % |
| 2019 | 10 | 13 | 12.82% |
| 2020 | 4 | 13 | 5.13% |
| 2021 | 12 | 14 | 14.29% |
| 2022 | 15 | 14 | 17.86% |
| 2023 | 17 | 14 | 20.24% |
| 2024 | 18 | 14 | 21.43% |
| 2025 | 16 | 14 | 19.05% |
| 2026 | 6 | 5 | 20.00% |
To this point 20% of games this year are ending with a coaching loss being handed out, which is on pace for the third highest rate since I started tracking this. This is an indication of parity, and lots of close games. Jim has handing out multiple CLs himself already.

