
Updated: 1/09/26
2025 Teams in Blue
Moved Up /Moved Down from last year
| # | Pre | Manager | W | L | W% | Games |
| 1 | 1 | Eric Pietrykowski | 3 | 0 | 100.00% | 3 |
| 2 | 3 | Kyle Serruys | 9 | 3 | 75.00% | 12 |
| 3 | n/a | Shaun Kelly | 2 | 1 | 66.67% | 3 |
| 4 | 4 | Ryan Kreger | 12 | 8 | 60.00% | 20 |
| 5 | 7 | Jon Jones | 24 | 17 | 58.54% | 41 |
| 6 | 6 | Trigger | 12 | 9 | 57.14% | 21 |
| 7 | 8 | Stephen Sanchez | 5 | 4 | 55.56% | 9 |
| 8 | 5 | Chris Tansuche | 19 | 16 | 54.29% | 35 |
| 9 | 9 | Byrd Bennett | 9 | 8 | 52.94% | 17 |
| 10 | 13 | Josh Kreger | 8 | 8 | 50.00% | 16 |
| 11 | 10 | Brian Kronner | 16 | 17 | 48.48% | 33 |
| 12 | 11 | Mark Kaiser | 12 | 13 | 48.00% | 25 |
| 13 | 12 | Matt Alley | 20 | 22 | 47.62% | 42 |
| 14 | 14 | John Sanchez | 4 | 5 | 44.44% | 9 |
| 15 | 15 | Dave Alley | 10 | 14 | 41.67% | 24 |
| 16 | 16 | Tim McLeod | 7 | 10 | 41.18% | 17 |
| 17 | 17 | Jim Toepel | 4 | 9 | 30.77% | 13 |
| 18 | 18 | Jason Kopeck | 1 | 3 | 25.00% | 4 |
| 19 | 19 | Matt Mollan | 0 | 1 | 0.00% | 1 |
| 19 | 19 | Bryan Pauly | 0 | 1 | 0.00% | 1 |
| 19 | 19 | Zach Hicks | 0 | 1 | 0.00% | 1 |
TOTAL PLAYOFF SEASONS (Since 2001)
- Jon Jones – 21
- Matt Alley – 18
- Chris Tansuche – 17
- Brian Kronner – 15
- Mark Kaiser – 14
- Dave Alley – 12
- Josh Kreger, Bryd Bennett, Tim McLeod – 10
- Jim Toepel, Trigger, – 9
- Ryan Kreger – 8
- Steve Sanchez – 5
- Kyle Serruys, John Sanchez – 4
- Jason Kopeck – 3
- Shaun Kelly, Eric Pietrykowski, Bryan Pauly, Matt Mollan, Zach Hicks – 1
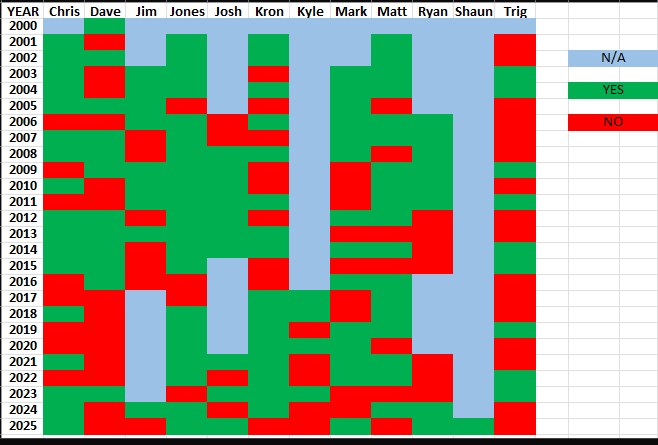
YEARS IN PLAYOFF
| # | PRE | MANAGER | SEASONS PLAYED | YEARS IN PLAYOFFS | SUCCESS RATE |
| 1 | 2 | Jon Jones | 25 | 21 | 84.00% |
| 2 | 1 | Byrd Bennett | 12 | 10 | 83.33% |
| 3 | 3 | John Sanchez | 5 | 4 | 80.00% |
| 4 | 5 | Matt Alley | 25 | 18 | 72.00% |
| 5 | 4 | Josh Kreger | 14 | 10 | 71.43% |
| 6 | 6 | Chris Tansuche | 25 | 17 | 68.00% |
| 7 | 7 | Stephen Sanchez | 8 | 5 | 62.50% |
| 8 | 9 | Mark Kaiser | 23 | 14 | 60.87% |
| 9 | 8 | Brian Kronner | 25 | 15 | 60.00% |
| 10 | 10 | Jim Toepel | 16 | 9 | 56.25% |
| 11 | 14 | Ryan Kreger | 15 | 8 | 53.33% |
| 12 | 12 | Jason Kopeck | 6 | 3 | 50.00% |
| 13 | 13 | Dave Alley | 26 | 12 | 46.15% |
| 14 | 11 | Kyle Serruys | 9 | 4 | 44.44% |
| 15 | 15 | Tim McLeod | 23 | 10 | 43.48% |
| 16 | 16 | Trigger | 25 | 9 | 36.00% |
| Min. 3 Years Played |
Most First-Round Exits (Since 2001)
While Jones has the most first-round losses, Josh has the highest percentage. In years he’s made the postseason, he’s lost in the opener 70% of the time, falling 7 times in 10 tries.
Jones – 9
Kronner – 8
Kaiser, Josh – 7
Chris, Toepel, Byrd, Timmy – 6
Dave, Matt – 4
Ryan, Trigger – 3
Jason – 2
Steve, John – 1
Kyle, Shaun – 0
PLAYOFF MATCHUP RECORDS
(Includes 3rd Place Trophy Game)
The most frequent matchups in league history are Matt vs. Tan (8 times) and Matt vs. Jones (9 times). The most dominating matchups Tan over Dave, and Trigger over Kronner; both 3-0 now.
| TEAM | DA | JJ | JK | MK | BK | KS | MA | RK | JT | CT | SK | MS |
| Dave | N/A | 1-0 | 1-1 | 0-2 | 2-0 | 0-1 | 0-2 | 0-2 | N/A | 0-3 | N/A | N/A |
| Jones | 0-1 | N/A | 0-1 | 2-1 | 4-1 | 1-1 | 6-3 | 1-1 | 1-0 | 1-3 | 1-0 | 3-1 |
| Josh | 1-1 | 1-0 | N/A | 0-1 | 0-2 | N/A | 1-1 | 2-0 | N/A | N/A | 0-1 | 1-1 |
| Kaiser | 2-0 | 1-2 | 1-0 | N/A | 1-2 | 0-1 | 2-1 | 0-1 | N/A | 2-2 | N/A | 1-1 |
| Kron | 0-2 | 1-4 | 2-0 | 2-1 | N/A | N/A | 2-2 | 1-1 | 2-0 | 0-1 | N/A | 0-3 |
| Kyle | 1-0 | 1-1 | N/A | 1-0 | N/A | N/A | 2-0 | N/A | N/A | 1-0 | N/A | 0-1 |
| Matt | 2-0 | 3-6 | 1-1 | 1-2 | 2-2 | 0-2 | N/A | 1-1 | 1-0 | 4-4 | N/A | 0-2 |
| Ryan | 2-0 | 1-1 | 0-2 | 1-0 | 1-1 | N/A | 1-1 | N/A | 2-1 | 2-2 | N/A | 1-0 |
| Shaun | N/A | N/A | 1-0 | N/A | N/A | N/A | N/A | N/A | N/A | N/A | N/A | N/A |
| Tan | 3-0 | 3-1 | N/A | 2-2 | 1-0 | 0-1 | 4-4 | 2-2 | 2-0 | N/A | 0-1 | 0-1 |
| Toep | N/A | 1-0 | N/A | N/A | 0-2 | N/A | 2-1 | 1-2 | N/A | 0-2 | N/A | 0-1 |
| Trig | N/A | 1-3 | 1-1 | 1-1 | 3-0 | 1-0 | 2-0 | 0-1 | 1-0 | 1-0 | N/A | N/A |
BYE WEEKS
Here’s a look at the results since introducing BYES back in 2015. Ten titles have been awarded since then (11th coming soon), and six of those runs began with a BYE. It’s no wonder Jones has so many recent championships, seeing as he gets to skip his weakness – the first round.
| Rank | Manager | W | L | W% | Games |
| 1 | Jon Jones | 6 | 1 | 0.857 | 7 |
| 2 | Chris Tansuche | 2 | 1 | 0.667 | 3 |
| 3 | Mark Kaiser | 2 | 2 | 0.500 | 4 |
| 3 | Ryan Kreger | 2 | 2 | 0.500 | 4 |
| 3 | Brian Kronner | 2 | 2 | 0.500 | 4 |
| 3 | Dave Alley | 2 | 2 | 0.500 | 4 |
| 3 | Trigger | 2 | 2 | 0.500 | 4 |
| 8 | Josh Kreger | 1 | 0 | 1.000 | 1 |
| 8 | John Sanchez | 1 | 0 | 1.000 | 1 |
| 8 | Eric Pietrykowski | 1 | 0 | 1.000 | 1 |
| 11 | Byrd Bennett | 1 | 1 | 0.500 | 2 |
| 12 | Stephen Sanchez | 1 | 2 | 0.333 | 3 |
| 12 | Kyle Serruys | 1 | 2 | 0.333 | 3 |
| 12 | Tim McLeod | 1 | 2 | 0.333 | 3 |
| 15 | Matt Alley | 1 | 5 | 0.167 | 6 |
| 16 | Jason Kopeck | 0 | 1 | 0.000 | 1 |
FINAL FOUR APPEARANCES
| MANAGER | 1st | 2nd | 3rd | 4th | TOTALS |
| Matt Alley | 1 | 5 | 2 | 6 | 14 |
| Jon Jones | 6 | 1 | 4 | 1 | 12 |
| Chris Tansuche | 2 | 1 | 5 | 3 | 11 |
| Brian Kronner | 2 | 2 | 2 | 3 | 9 |
| Dave Alley | 2 | 2 | 0 | 4 | 8 |
| Mark Kaiser | 2 | 2 | 2 | 1 | 7 |
| Trigger | 2 | 2 | 0 | 2 | 6 |
| Ryan Kreger | 2 | 2 | 1 | 0 | 5 |
| Tim McLeod | 1 | 2 | 0 | 1 | 4 |
| Byrd Bennett | 1 | 1 | 2 | 0 | 4 |
| Stephen Sanchez | 1 | 2 | 1 | 0 | 4 |
| Kyle Serruys | 1 | 2 | 0 | 1 | 4 |
| John Sanchez | 1 | 0 | 0 | 2 | 3 |
| Josh Kreger | 1 | 0 | 2 | 0 | 3 |
| Jim Toepel | 0 | 0 | 2 | 0 | 2 |
| Jason Kopeck | 0 | 1 | 0 | 0 | 1 |
| Eric Pietrykowski | 1 | 0 | 0 | 0 | 1 |
| Shaun Kelly | 0 | 0 | 1 | 0 | 1 |
THE TITLE GAME
Here are the records for the final.
| Rank | Manager | W | L | W% | Games |
| 1 | Jon Jones | 6 | 1 | 0.857 | 7 |
| 2 | Chris Tansuche | 2 | 1 | 0.667 | 3 |
| 3 | Mark Kaiser | 2 | 2 | 0.500 | 4 |
| 3 | Ryan Kreger | 2 | 2 | 0.500 | 4 |
| 3 | Brian Kronner | 2 | 2 | 0.500 | 4 |
| 3 | Dave Alley | 2 | 2 | 0.500 | 4 |
| 3 | Trigger | 2 | 2 | 0.500 | 4 |
| 8 | Josh Kreger | 1 | 0 | 1.000 | 1 |
| 8 | John Sanchez | 1 | 0 | 1.000 | 1 |
| 8 | E. Pietrykowski | 1 | 0 | 1.000 | 1 |
| 11 | Byrd Bennett | 1 | 1 | 0.500 | 2 |
| 12 | S. Sanchez | 1 | 2 | 0.333 | 3 |
| 12 | Kyle Serruys | 1 | 2 | 0.333 | 3 |
| 12 | Tim McLeod | 1 | 2 | 0.333 | 3 |
| 15 | Matt Alley | 1 | 5 | 0.167 | 6 |
| 16 | Jason Kopeck | 0 | 1 | 0.000 | 1 |


You must be logged in to post a comment.